Saturday 30 June 2012

Current Economic Scenario - Part III

Current Economic Scenario – Part III


Last two blogs talked about the current situation of Indian Economy, here we will be talking about what happens if one of the Components of our economy changes.


  • Appreciation/Depreciation of rupee and its effects


This suggests that the most favorable scenario for the economy would be of Rupee Appreciation. Here, it is important to note that in an ideal scenario (Good GDP Growth rate, controlled inflation measures) Foreign Domestic Investment i.e. Foreign Investment in India increases with the weakening of rupee (more rupee for 1$) but in current scenario it is very important to infuse confidence into the Foreigners regarding Indian Economy.
Let’s say if You and I have got 1 billion dollars to invest than a rupee conversion rate would not matter as much as a prospective return on our investment which is indicated by a good GDP growth rate.

Investment opportunities if the Rupee appreciates:-

  1. Buy Govt. bonds as the yields will most likely decrease (due to decreasing inflation), increasing the Bond’s price.

  1. Buy the stocks of cyclical industries (industry which do well in good economic times). Example: Auto industry, Infrastructure industries, Luxury Goods industry, etc.

Investment opportunities if the Rupee depreciates:-

  1. Buy stocks of non-cyclical industry like staple goods, agriculture, etc. as the demand for these goods will increase with the ever-rising population.

*This scenario is very unlikely looking at the current situation and policy actions.

-Change in Crude Oil Prices


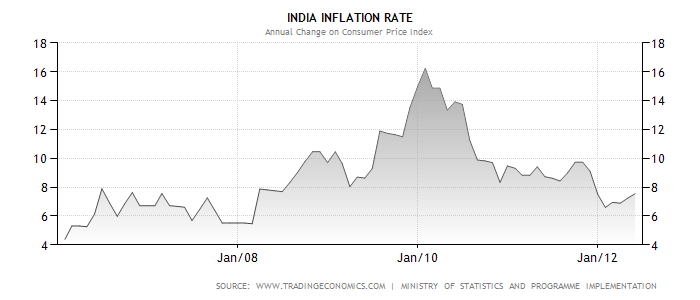
A further decrease in crude oil prices would be the most fortunate thing that could happen to revive the economy. This would mean that the supply side pressures get eased automatically reducing the inflation rate (disinflation) and thereby also increasing the demand for other industrial products and reviving the GDP growth rate marginally.


Investment opportunities if the Oil Prices Reduce:


  1. Buy Govt. bonds as reduced inflation would mean a decrease in require yields and an increase in bond prices.
  2. Buy stocks of non-cyclical industries as only a reduction in oil prices with other scenario unchanged is not supposed to revive the economy substantially.


An increase in crude oil prices with no change in currency exchange rate would be an economic disaster for the country, creating an upward inflationary spiral and reducing GDP to a great extent i.e. a situation of severe stagflation. It is very important for the Economic Bodies to react before any of these happen as a key to this problem has not been found till now and could lead to a severe depression.


Monday 25 June 2012

Current Economic Scenario - Part II

GLOSSARY
Headline Inflation: A measure of the total inflation within an economy and is affected by areas of the market which may experience sudden inflationary spikes such as food or energy.

Core Inflation: Also called underlying inflation, which excludes factors such as food and energy costs.
Exchange rate: INR/USD means amount of Indian rupees per U.S dollar

Appreciation of rupee: Rupee getting stronger i.e. less rupees is needed to get 1 dollar.

Depreciation of rupee: Rupee getting weaker i.e. more of rupees is needed to get 1 dollar.

* Inflation chart, Growth Chart, and population chart has been taken from the website www.tradingeconomics.com

* Crude oil prices chart has been taken from www.infomine.com


             Inflation And Growth
Growth of Indian Economy has been quite a story in itself, growing faster and more sustainably then most of the other economies in the world. USP of Indian Economy is the population of India which allows it to be a self-sustaining nation. However recent trend has not been quite favorable i.e. Indian economy has been witnessing slowing growth, population increasing at an exponential rate and an increasing inflation, worsening the standard of living in the country.


ParameterGrowth Rate
G.D.P5.3%
Inflation8%
Population4.7%


Again a graphical representation of these would help us better understand the state of the economy.


As can be seen since the starting of the year 2012 Indian economy is facing slowing growth and increasing inflation (economics name it “Stagflation”).
Now to get a better insight into the causes of this scenario we can look into the data of population growth. Before saying anything further it would be better to look at the population growth graph of India:


According to last census Indian population grew at a rate of 4.7% to get to 1210 million people.
So this certainly means that there is enough willingness of the people to buy more goods but maybe it is the constant increase in prices which is hammering the growth in demand. However it would be wrong to say that demand has been decreasing, because looking at the demographics India has enough demand generation within the economy. But it would not be wrong to mention that this demand however is for staple goods i.e. “Roti, Kapda, Makaan”. Here is another figure which would prove this point:


India industrial production growth had slipped into negative and now getting just to around zero percent. It’s important to note here that this means Indian Industrial Production is approximately at the level at which it was in August-October 2011.

Now the GDP rising at around 6% annually and Industrial production not rising at all suggests that this growth in GDP has practically been achieved from Agriculture and Tertiary sectors.
The demand for agriculture products and basic services has what kept GDP from falling further.

Now shifting our focus to inflation figures, it has been increasing at very rapid rate even though the economy is experiencing a slowing growth.


From the starting of the year inflation has been increasing almost at the rate of 7% which is undoubtedly high even for a growing economy like India. Recent policy action of RBI of choosing to tame inflation instead of fueling slowing growth hints how big this problem really is.

It is important to see here that this inflation is probably not caused by an increase in demand (the general theory that if demand increases price will also be increased by the producers) but because of pressures on the supply side of the economy.

Now what do we mean by pressures on supply side? It simply means that there has been an increase in the input cost for suppliers (manufacturers) of the goods namely natural resources and inputs which are inevitable for the production process to complete. Out of everything “ Crude Oil “ is the most talked about resource and correctly so, being the most essential input to any production process.


Crude oil prices have dipped from around 115$ to 90$ in about a year which suggests that there should be a decrease in the input costs of the suppliers, however since India depends largely on Crude Oil imports and because of the rupee depreciation being more than the percentage fall in oil prices it has been a major reason behind the current rise in inflation rate.

It is also important to know that Headline Inflation (the total inflation considering also Food items) is at 7.5% whereas Core inflation which does not consider food items is just below 5% i.e. 4.96%. As earlier mentioned this again supports the point that demand for staple goods like food and basic services has been increasing because of the increasing population. Therefore, Headline inflation has been increasing because of both supply side as well as demand side pressures. A good action here would be to easing of the supply side pressures of the Staple Goods producers like farmers, transport services, etc. This would help lowering the inflation rate prevailing in the economy.

It is also important to understand here that because the income of common man is getting consumed in purchasing now more costlier staple goods or basic necessities of life hence the demand for other Industrial products is decreasing which is consequently reducing the IIP(India Industrial Production)

Current Economic Scenario - Part I

GLOSSARY
Balance of trade: In mathematical equation it is simply Exports minus Imports i.e. excess of exports over imports.
Exchange rate: INR/USD means amount of Indian rupees per U.S dollar
Appreciation of rupee: Rupee getting stronger i.e. less rupees is needed to get 1 dollar.
Depreciation of rupee: Rupee getting weaker i.e. more of rupees is needed to get 1 dollar.
* All the charts i.e. Import chart, Export chart and Balance of Trade chart has been taken from the website www.tradingeconomics.com
* The import data mentioned in the article has been taken from the Government website of commerce.


                   BALANCE OF TRADE


Balance of payments had been decreasing continuously from January 2006 to January 2008, taking a steep jump upwards in the year 2009 and then again following the decreasing trend. After reaching its trough in January 2012 it has started increasing once again, the reason being a decrease in imports. Imports decreased more than exports ( The chart given below shows the data in USD Million)


Imports declined by more than 5000 million dollars whereas exports declined by around 2500 million dollars, narrowing the difference in Balance of payments. The reason behind such a decrease in imports is mainly the depreciation of rupee but more importantly it’s also the inflation in foreign countries (from where India imported a substantial amount of goods) which played its part. Top five countries and their percentage share in India’s import is given below :


2009-10
2010-11
2011-12(Apr- September)
SWITZERLAND
5.076
6.69
6.55
U S A
5.90
5.42
4.96
SAUDI ARAB
5.91
5.51
6
U ARAB EMTS
6.73
8.85
7.45
CHINA P RP
10.70
11.76
12.22


Top five countries and their net share in India's imports:
(Amounts are in rupees lakhs)


2009-10
2010-11
2011-12(Apr-September)
SWITZERLAND
3,461,600.96
5,636,978.55
6,112,304.21
U S A
4,029,216.35
4,567,925.16
4,631,623.82
SAUDI ARAB
4,033,214.18
4,642,745.29
5,602,504.28
U ARAB EMTS
4,589,942.52
7,456,168.92
6,957,784.11
CHINA P RP
7,302,430.60
9,903,953.79
11,408,740.89

Note: Value of full year imports of the years 2009-10 and 2010-11 has been halved to make it comparable to 2011-12 (April to September) I.e. to find the full value of imports during the years 2009-10 and 2010-11 you will have to multiply it by 2.

The increase in imports in all of these top five countries is very marginal, signaling the reason why India’s imports fell in past few months. Depreciation of rupee is a well-known reason behind this fall but adding to it was also steep rise in inflation in these countries namely U S A and China. Graphical representation of inflation in both the countries is given below:


Note that both in U S A and China inflation rate has fallen in the year 2012 however it is important to note a steep rise (China from 2 percent to 6 percent and U S A from 1.5% to 4%) in the year 2011. We have to understand the fact that inflation rate in foreign countries has a lagging effect on domestic imports. Coupled with steep fall in rupee against dollar it had a compounded effect on India’s import.

Talking about fall in exports, there again have been two major reasons behind it. One is slowing growth in foreign countries which has decreased their demand for Indian goods. The second reason is rise in U.S dollar against rupee which has reduced the net inflow of dollars in India thereby reducing the dollar value of exports.

This could be better understood with an example:

Assume there is a good worth rs.100 being exported to USA and current exchange rate is INR/USD = 45rs. (Exchange rate which prevailed for the major part of the year 2011)
Therefore the exporter gets 2.2$ for his good. ( 100 divided by 45 )
Now suppose that due to inflation of 7.2% (current rate of inflation in India) the price of good rises to around 107rs and also the exchange rate changes to 55rs (current average exchange rate).

Therefore now the exporter will get only 1.94$ (107 divided by 55)

This occurs because percentage change in Depreciation of rupee has been more than rate of inflation.

Note: Here we have considered the effect of inflation on our exporter’s good but it might not be necessary that every good would be affected by inflation and it might also be possible that the exporter does not have pricing power and thereby chooses not to increase the price of the good and in turn compensate that loss with the depreciation of rupee.

Friday 4 May 2012

2008 - Year of Global Meltdown


2008 : The Year of Global Meltdown

The article details the fallout within the Financial Industry in 2008.
Some terms used in the article :
CCI : This index is a barometer of Health of the Economy from the consumer’s perspective.
Gross Domestic Product (GDP) : Total production of goods and services in a country.