2008 : The Year of Global Meltdown
The article details the fallout within the Financial Industry in 2008.
Some terms used in the article :
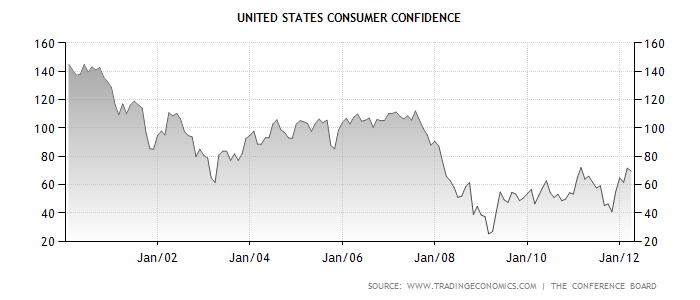
CCI : This index is a barometer of Health of the Economy from the consumer’s perspective.
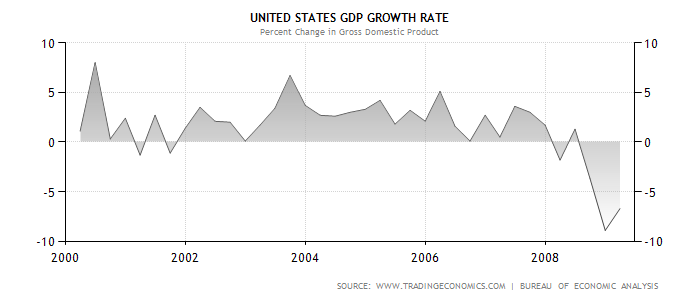
Gross Domestic Product (GDP) : Total production of goods and services in a country.

Probably looking at this chart you would not find anything wrong in it, but the second look and you realise there is something wrong about it. What is it? Demand curve is upward sloping? How is that possible? How can be people willing to buy more when price of a commodity rises? What is the reason behind such irrational behaviour of people?
This simple yet perplexing chart is the root cause of “ GLOBAL MELTDOWN of 2008”
For 50 years after WWII, the U.S. housing market grew steadily with just a few setbacks as prices increased. But then something happened not suddenly but over the time which led to one of the biggest financial crisis in 2008. Now you might want to ask what happened which led to such a debacle all around the world. The answer is “The AMERICAN DREAM”, the dream which was supposed to provide housing to all the U.S citizens. This dream which in no case seems to be harmful left millions of people homeless not only in U.S.A but all around the world. What was so wrong about this dream which led to such a debacle? Nothing, but just the way it was pursued.
Asset – Securitization another term which now almost every financial individual around the world fears.
Before saying anything about it, it is necessary to understand what it actually is.
Asset-securitization is a process where by banks sell the undivided interest in the pool of mortgage loans made by them to common investors. The flow – chart will help in a better understanding of the product.
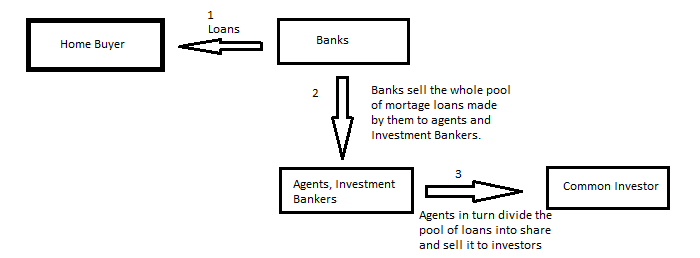
In this structure once the banks sell – off their loans to Agents and they in turn sell it off to common investors, banks loose the right of earning interest on the loans made and in turn that right transfers to the ultimate common investor. But along with it transfers the risk of Home Buyer defaulting and the common investor losing all his money.
What was the result of this seemingly un-harmful investment product? This structure made bankers all around USA greedy and tempted them to give more such loans because they could easily sell off these loans to “Agents” and earned a lucurative profit over it. This greed reached a level where they began to give loans to people who they knew would not be able to pay it off. This led to easy availability of loans to any Tom, Dick and Harry which created a false demand of HOMES all over the United States, thereby prices of real-estate began to skyrocket and yet the demand did not fall but instead increased along with it. People expected the real-estate prices to keep rising and therefore they started demanding more of it. By 2008 an average U.S citizen had around 4-5 houses each without giving any thought to how he will repay the loans whatsoever. But the bubble finally burst in 2008 when people couldn’t repay loans giving rise to huge losses to “Common Investors” and bankruptcy of various Financial Institutions, Insurance Agencies and even certain banks. This chain of bankruptcy did not spare anyone, even the largest of names failed leading to a sharp fall in Consumer Confidence Index ( CCI).
This credit crunch was so huge that it forced U.S GDP to get negative and the CCI which was at a level of 140 has still not crossed the level of 70.
Now the question arising would be how did all this affect the whole world? We are living in a “Global Village” which means that if there is crisis at one part of the village then the other parts can not go un-affected. Countries like China, Singapore, Middle-east had great exposure to the U.S markets, majority of their revenues came from the exports to USA. Once the domestic economy of U.S.A suffered a crisis demand for the products of these countries fell sharply leading to a tremendous fall in the revenues and employment of these countries.
Some data which enlightens the above mentioned points is given below :
Export - Import data for the year 2008
| Countries | Exports from U.S.A(million $) | Imports to U.S.A(million $) |
| Europe | 321,151 | 440,802 |
| France | 28,603 | 44,036 |
| Germany | 54,209 | 97,597 |
| Italy | 15,330 | 36,140 |
| Canada | 261,872 | 342,920 |
| Mexico | 151,147 | 219,808 |
| China | 69,552 | 337,963 |
| India | 17,623 | 25,739 |
| Japan | 64,457 | 139,587 |
As can be seen that Europe, Canada and China exported huge amount of goods and services to USA hence the recession in USA followed to such countries hampering their GDP too. India was not as badly affected by the recession as China simply because India’s exposure to the U.S markets was limited as compared to China.
What now?
Even till now, The U.S economy has not yet revived completely from the setbacks faced in 2008. As can be seen in the above figures America’s GDP as well as CCI which is one of the most important measure of the state of a country’s economy has still not revived to even 50% of its peak suggesting very clearly that revival of the World Economies is going to take longer than presumed to be.
Current Scenario
U.S government is currently infusing billions of dollars in the economy to try and lift up the consumer’s confidence on the economy, but to no avail.
After shocks of the U.S credit crisis are felt in Europe and the situations are getting worse by the hour.
China, which has invested billions of dollars in U.S government bonds is standing on a double-edged sword.
All this leads to one question which is still debatable, In this Globalized world,exponential development of certain economies is always good or is it an “Caution Sign” for the other economies in the world?
*CCI and GDP charts have been taken from www.tradingeconomics.com
No comments:
Post a Comment