GLOSSARY
Balance of trade: In mathematical equation it is simply Exports minus Imports i.e. excess of exports over imports.
Exchange rate: INR/USD means amount of Indian rupees per U.S dollar
Appreciation of rupee: Rupee getting stronger i.e. less rupees is needed to get 1 dollar.
Depreciation of rupee: Rupee getting weaker i.e. more of rupees is needed to get 1 dollar.
* All the charts i.e. Import chart, Export chart and Balance of Trade chart has been taken from the website www.tradingeconomics.com
* The import data mentioned in the article has been taken from the Government website of commerce.
BALANCE OF TRADE
Balance of payments had been decreasing continuously from January 2006 to January 2008, taking a steep jump upwards in the year 2009 and then again following the decreasing trend. After reaching its trough in January 2012 it has started increasing once again, the reason being a decrease in imports. Imports decreased more than exports ( The chart given below shows the data in USD Million)

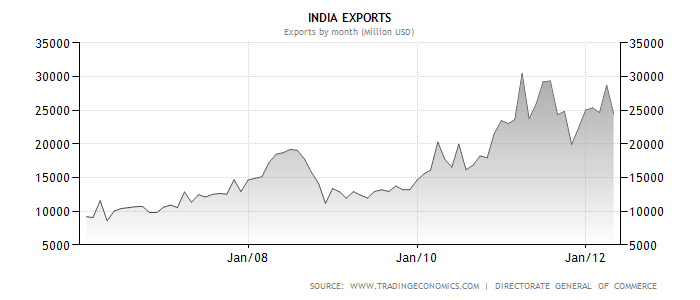
Imports declined by more than 5000 million dollars whereas exports declined by around 2500 million dollars, narrowing the difference in Balance of payments. The reason behind such a decrease in imports is mainly the depreciation of rupee but more importantly it’s also the inflation in foreign countries (from where India imported a substantial amount of goods) which played its part. Top five countries and their percentage share in India’s import is given below :
2009-10
|
2010-11
|
2011-12(Apr- September)
| |
| SWITZERLAND |
5.076
|
6.69
|
6.55
|
| U S A |
5.90
|
5.42
|
4.96
|
| SAUDI ARAB |
5.91
|
5.51
|
6
|
| U ARAB EMTS |
6.73
|
8.85
|
7.45
|
| CHINA P RP |
10.70
|
11.76
|
12.22
|
Top five countries and their net share in India's imports:
(Amounts are in rupees lakhs)
2009-10
|
2010-11
|
2011-12(Apr-September)
| |
| SWITZERLAND |
3,461,600.96
|
5,636,978.55
|
6,112,304.21
|
| U S A |
4,029,216.35
|
4,567,925.16
|
4,631,623.82
|
| SAUDI ARAB |
4,033,214.18
|
4,642,745.29
|
5,602,504.28
|
| U ARAB EMTS |
4,589,942.52
|
7,456,168.92
|
6,957,784.11
|
| CHINA P RP |
7,302,430.60
|
9,903,953.79
|
11,408,740.89
|
Note: Value of full year imports of the years 2009-10 and 2010-11 has been halved to make it comparable to 2011-12 (April to September) I.e. to find the full value of imports during the years 2009-10 and 2010-11 you will have to multiply it by 2.
The increase in imports in all of these top five countries is very marginal, signaling the reason why India’s imports fell in past few months. Depreciation of rupee is a well-known reason behind this fall but adding to it was also steep rise in inflation in these countries namely U S A and China. Graphical representation of inflation in both the countries is given below:

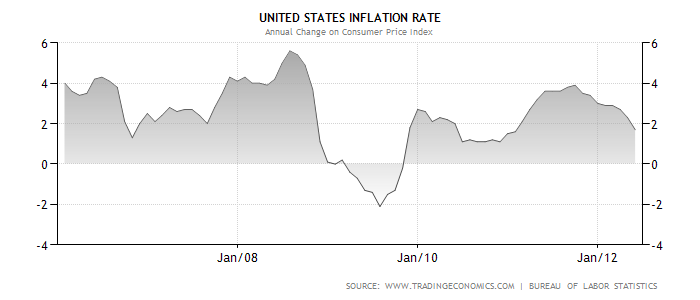
Note that both in U S A and China inflation rate has fallen in the year 2012 however it is important to note a steep rise (China from 2 percent to 6 percent and U S A from 1.5% to 4%) in the year 2011. We have to understand the fact that inflation rate in foreign countries has a lagging effect on domestic imports. Coupled with steep fall in rupee against dollar it had a compounded effect on India’s import.
Talking about fall in exports, there again have been two major reasons behind it. One is slowing growth in foreign countries which has decreased their demand for Indian goods. The second reason is rise in U.S dollar against rupee which has reduced the net inflow of dollars in India thereby reducing the dollar value of exports.
This could be better understood with an example:
Assume there is a good worth rs.100 being exported to USA and current exchange rate is INR/USD = 45rs. (Exchange rate which prevailed for the major part of the year 2011)
Therefore the exporter gets 2.2$ for his good. ( 100 divided by 45 )
Now suppose that due to inflation of 7.2% (current rate of inflation in India) the price of good rises to around 107rs and also the exchange rate changes to 55rs (current average exchange rate).
Therefore the exporter gets 2.2$ for his good. ( 100 divided by 45 )
Now suppose that due to inflation of 7.2% (current rate of inflation in India) the price of good rises to around 107rs and also the exchange rate changes to 55rs (current average exchange rate).
Therefore now the exporter will get only 1.94$ (107 divided by 55)
This occurs because percentage change in Depreciation of rupee has been more than rate of inflation.
Note: Here we have considered the effect of inflation on our exporter’s good but it might not be necessary that every good would be affected by inflation and it might also be possible that the exporter does not have pricing power and thereby chooses not to increase the price of the good and in turn compensate that loss with the depreciation of rupee.
great job .. never thought about the effect of rupee depreciation on balance of trade ... will definitely follow .
ReplyDeleteThankyou :)
ReplyDelete